BizTalk Services Bridges/Operations – Troubleshooting
Windows Azure BizTalk Services (WABS) is general since November 2013 as a service within Windows Azure. Recently it has been enhanced with new features like backup/restore.
This new service in Windows Azure is meant to provide EAI or B2B services through the cloud. The EAI Service enables you to exchange data through different protocols and transform it to and from different formats. Similar to what the on premise BizTalk offers through mapping and routing. The B2B services offer Businesses to exchange data between their partners. You can view it as a new way of EDI data exchange other than a value added network (VAN).
During provisioning of a BizTalk Service you need to specify tracking database (Windows Azure SQL Database), and a storage account for monitoring and archiving.

The tracking data can be useful for diagnostic purposes and to monitor what messages goes through BizTalk Service.
The Tracking Database can be extended to meet your own tracking requirements, see Windows Azure BizTalk Services EAI Bridges – Diagnostics. You can also use the tracking data for troubleshooting combined with the debug logs stored in your storage account. The recent February release included integration with the operation logs a part of the Windows Azure Management Service. This gives you the ability to troubleshoot issue you might face with the BizTalk Service itself.
Partition Key column 6,35239E+17
Row Key 1d0c1f327e9c4b6e9a7e8ed405732638__IntegrationRole___IntegrationRole_IN_0___0000000001652031490___WADLogsLocalQuery TimeStamp 12/29/2013 3:14:52 PM
EventTickCount 635228233283452000
Deployment ID 1d0c1f327e9c4b6e9a7e8ed405732638
RoleInstance IntegrationRole IntegrationRole_IN_0
EventID 30008
Pid 3216
Tid 104
Message column Stage validator execute called.
RequestId = f3d60453-a63a-44e9-811a-7ac47e1b111d. TrackId = f3d60453-a63a-44e9-811a-7ac47e1b111d. ServiceNamespace = default.
RuntimeUrl = /xmlrequestreplybridge1.; TraceSource 'Microsoft-Integration-PipelineService' event
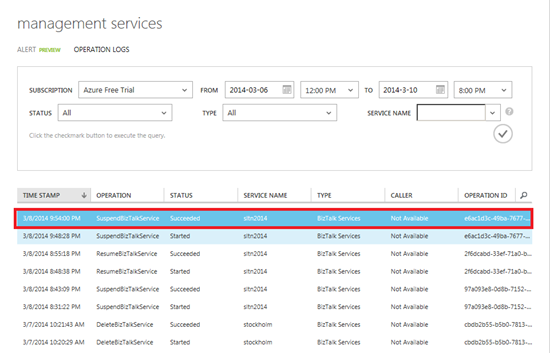
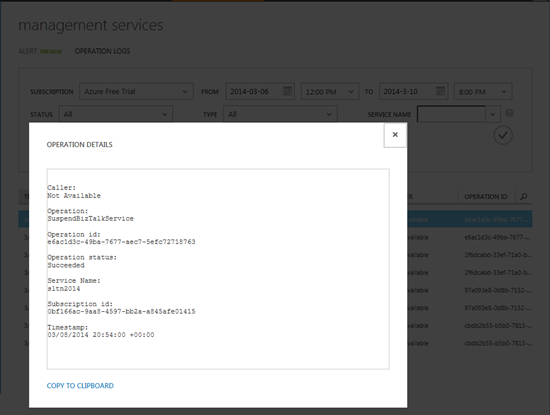
You can click any operation and view the details. You can do so by selecting a specific row and click Details from the bottom of the page.
This post has provided some insight how to troubleshoot a BizTalk Service Bridge. There are two main sources, where you can find data for troubleshooting. That is, through tracking database in the Windows Azure SQL Database, which contains the data that is visible in tracking messages feature of the BizTalk Services Portal. And the storage account that has blobs and tables. The WADLogsTable contains debug logs you can access to have a clear view of what is going inside the bridge. Besides these two sources there is the operations logs within the Management Service that can give you details about specific BizTalk Service operations.
Cheers,
Steef-Jan
This new service in Windows Azure is meant to provide EAI or B2B services through the cloud. The EAI Service enables you to exchange data through different protocols and transform it to and from different formats. Similar to what the on premise BizTalk offers through mapping and routing. The B2B services offer Businesses to exchange data between their partners. You can view it as a new way of EDI data exchange other than a value added network (VAN).
During provisioning of a BizTalk Service you need to specify tracking database (Windows Azure SQL Database), and a storage account for monitoring and archiving.

The tracking data can be useful for diagnostic purposes and to monitor what messages goes through BizTalk Service.
The Tracking Database can be extended to meet your own tracking requirements, see Windows Azure BizTalk Services EAI Bridges – Diagnostics. You can also use the tracking data for troubleshooting combined with the debug logs stored in your storage account. The recent February release included integration with the operation logs a part of the Windows Azure Management Service. This gives you the ability to troubleshoot issue you might face with the BizTalk Service itself.
Storage account
Provisioning of a BizTalk Service includes a step, where you specify a storage account. In the final tab called Specify monitoring/archiving settings you specify the storage account. You either create a new or use an existing storage account to store monitoring and archiving data. Note that this storage account can be used by only one BizTalk Service! During provisioning the following will happen:- A storage account will be created in case an existing storage account has not been assigned,
- Blob containers (blobs, tables) will be created.
After provisioning you could access what’s available in these containers using the server explorer. Within Visual Studio, navigate to Windows Azure in the Server Explorer, select Storage. You subsequently need to log in and then you can navigate to your storage account.
You can view what's inside the blobs and tables. By right clicking on the blobs you can see what is inside.
By right clicking on the tables you can view the contents.
Troubleshooting
Each message send to a BizTalk Service, for instance to a bridge endpoint a response will be sent back. Regardless if it is successful or a failure. The header of the response includes a tracking ID. This ID can be used in the Tracking Messages feature in Windows Azure BizTalk Services Portal to troubleshoot. You can use the BizTalk Service explorer to send a message to a bridge and see what the tracking id is.In the Windows Azure Portal under Tracking you can see the information regarding the message being sent to the Bridge Endpoint.
You can select the event and click Details in the lower pane of the portal.
This metadata is retrieved from the database residing in Windows Azure SQL Database.
You can view more details through debug logs, which are available in the WADLogsTable. You can select the details from the table and paste it in excel. Below you see the what is under the message column, which can be interesting to see what's in this case happens in the bridge.
The debug logs in the table contain the following information:
- Loading an assembly
- Adding or updating an artifact, like a Transform
- Adding, updating, or deleting Bridge Configuration
- Message submitted to the Bridge pipeline
- Bridge stages, including their Begin Execute and End Execute events
- Faults
Partition Key column 6,35239E+17
Row Key 1d0c1f327e9c4b6e9a7e8ed405732638__IntegrationRole___IntegrationRole_IN_0___0000000001652031490___WADLogsLocalQuery TimeStamp 12/29/2013 3:14:52 PM
EventTickCount 635228233283452000
Deployment ID 1d0c1f327e9c4b6e9a7e8ed405732638
RoleInstance IntegrationRole IntegrationRole_IN_0
EventID 30008
Pid 3216
Tid 104
Message column Stage validator execute called.
RequestId = f3d60453-a63a-44e9-811a-7ac47e1b111d. TrackId = f3d60453-a63a-44e9-811a-7ac47e1b111d. ServiceNamespace = default.
RuntimeUrl = /xmlrequestreplybridge1.; TraceSource 'Microsoft-Integration-PipelineService' event
Operation Logs
The integration of BizTalk Services to the operation logs of the Management Service has been an enhancement of the February 2014 release. You can view the operations performed on the BizTalk Service, see MSDN Operations Tracked Using Azure Management Services.
You can click any operation and view the details. You can do so by selecting a specific row and click Details from the bottom of the page.

This post has provided some insight how to troubleshoot a BizTalk Service Bridge. There are two main sources, where you can find data for troubleshooting. That is, through tracking database in the Windows Azure SQL Database, which contains the data that is visible in tracking messages feature of the BizTalk Services Portal. And the storage account that has blobs and tables. The WADLogsTable contains debug logs you can access to have a clear view of what is going inside the bridge. Besides these two sources there is the operations logs within the Management Service that can give you details about specific BizTalk Service operations.
Cheers,
Steef-Jan



Comments